

Quantifying GPU Performance overhead for Quantizated LLMs


TL;DR
We profile three state-of-the-art GPU kernels for quantized LLM inference—AWQ, Marlin, and Flute—to quantify the overhead of dequantization. We find that dequantization accounts for 30-45% of the total energy consumption, despite showing near-ideal speedups in wall time. This highlights a hidden cost in quantized inference that needs to be addressed for more energy-efficient deployment.
Intro
As large language models (LLMs) see ever-wider deployment, inference efficiency has become critical. Quantization reduces memory footprint and can boost throughput, but it incurs a hidden cost: dequantization. On GPUs (and many NPUs), dequantization is often masked by memory-bound GEMV stages, so wall-time measurements may overlook it. In reality, each dequantization step invokes floating-point or vector operations on CUDA cores (or NPU vector arrays), consuming both cycles and energy. Prior work has largely focused on end-to-end latency of quantized GEMM, with little attention to the dequantization overhead that actually drives power draw. In this post, we profile three state-of-the-art kernels—AWQ, Marlin and Flute—to quantify how much time, instruction count, and energy consumption of dequantization on a modern GPU.
Profiling Setup
Kernels under test
We pick three typical GPU kernels that are high optimized and widely used in LLM inference: Marlin, AWQ(TinyChat), and Flute. involving typical Integer dequantization, and look-up table (LUT) based dequantization. The conceptual dequantization operations are show below:
- Marlin: $W = s \times x$
- AWQ (TinyChat): $W = s \times x + z$
- Flute: $W = \mathrm{LUT}[x]$
where $x\in{0,1,\dots,15}$ is a 4-bit integer, $s,z$ are FP16 scalars, and LUT is a 16-entry FP16 look-up table.
Hardware
- NVIDIA A100 (Ampere architecture, which is the target platform for all three kernels above)
- 108 SMs × (64 CUDA cores + 4 Tensor cores each)
- Mixed-precision pipeline: dequantize weights to FP16, activation inputs FP16, accumulate in FP32.
- Manually lock the SM frequency to 1.1 GHz to avoid frequency scaling effects.
Roofline model
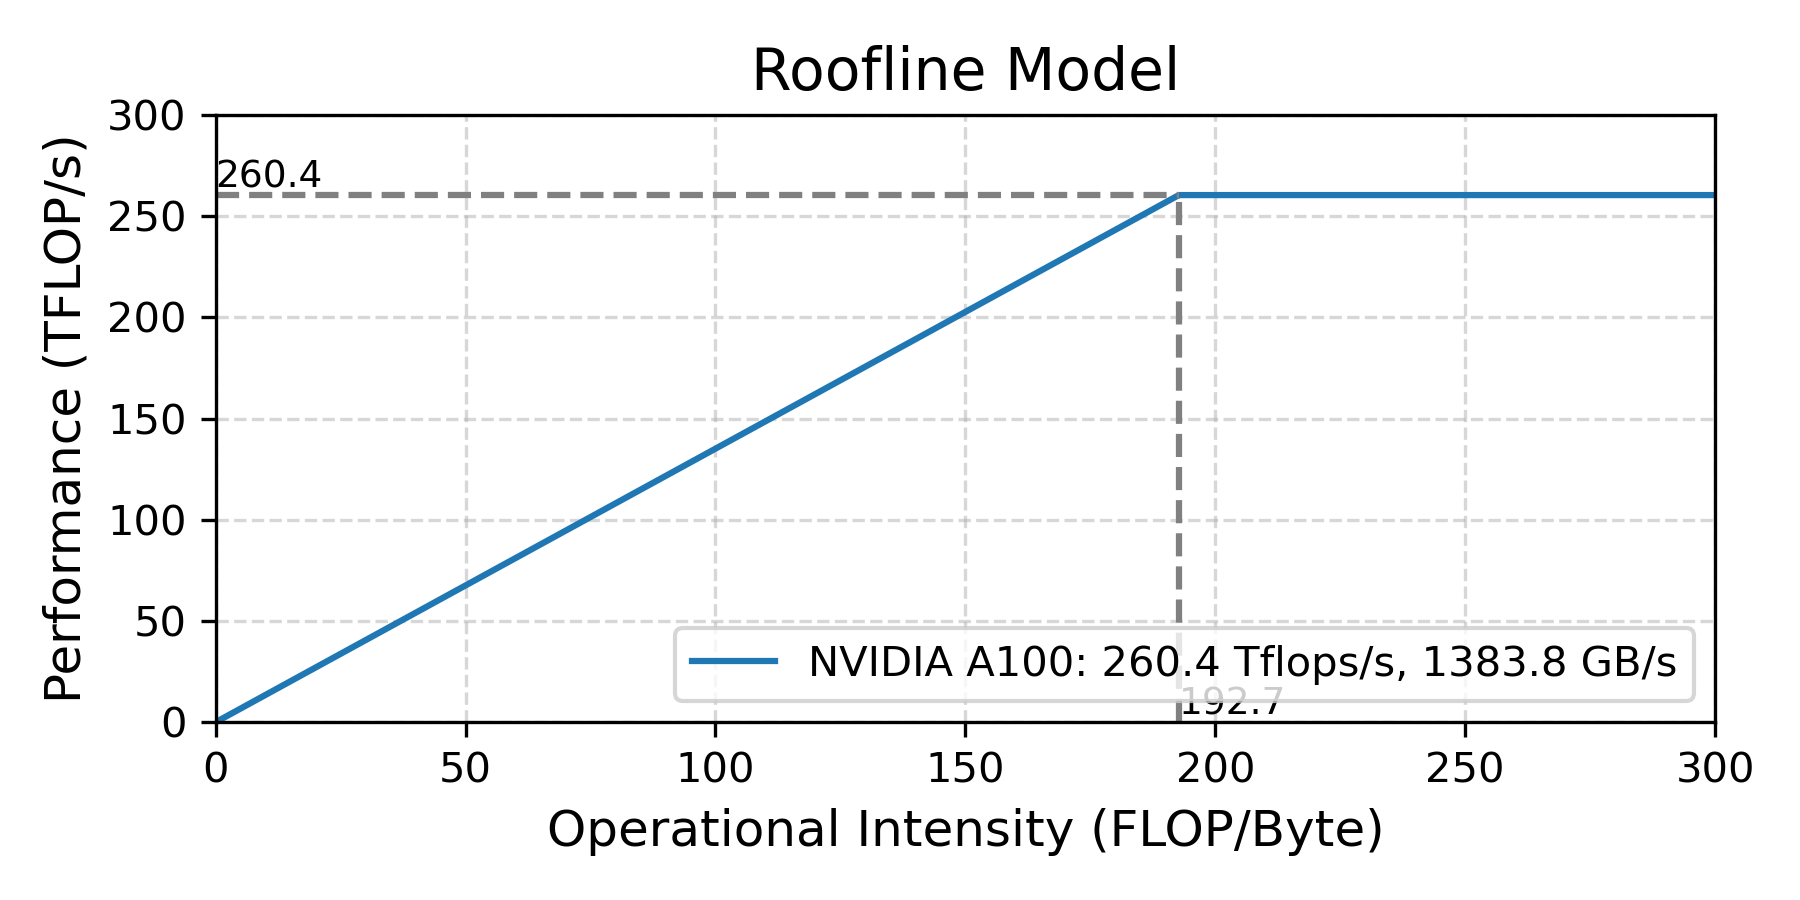
- Peak compute: 260.4 TFLOP/s
- Peak memory bandwidth: 1383.8 GB/s
Measurement methodology
Overhead isolation: To measure the impact of dequantization, we follow a subtractive methodology, in which we remove the processing steps one by one and measure the change in performance. This allows us to isolate the overhead of dequantization from the overall kernel execution time. Specifically, we compare the following variants:
- Original kernel
- No-op dequantization (replace dequant step)
- No-op dequant + No-op MMA (baseline for data transfer & misc.)
- No-op MMA (optional, to test only the dequantization operations)
Throughput & instructions: NVIDIA Nsight Compute.
Energy estimate: NVML power API (nvmlDeviceGetPowerUsage × kernel runtime).
Results
Below is the result summary of the profiling. The input weight matrix is 4096×4096, and the output activation matrix is BS×4096, where BS is the batch size.
| Kernel | Batch size | Operations | Instructions(%) | Time(%) | Energy(%) |
|---|---|---|---|---|---|
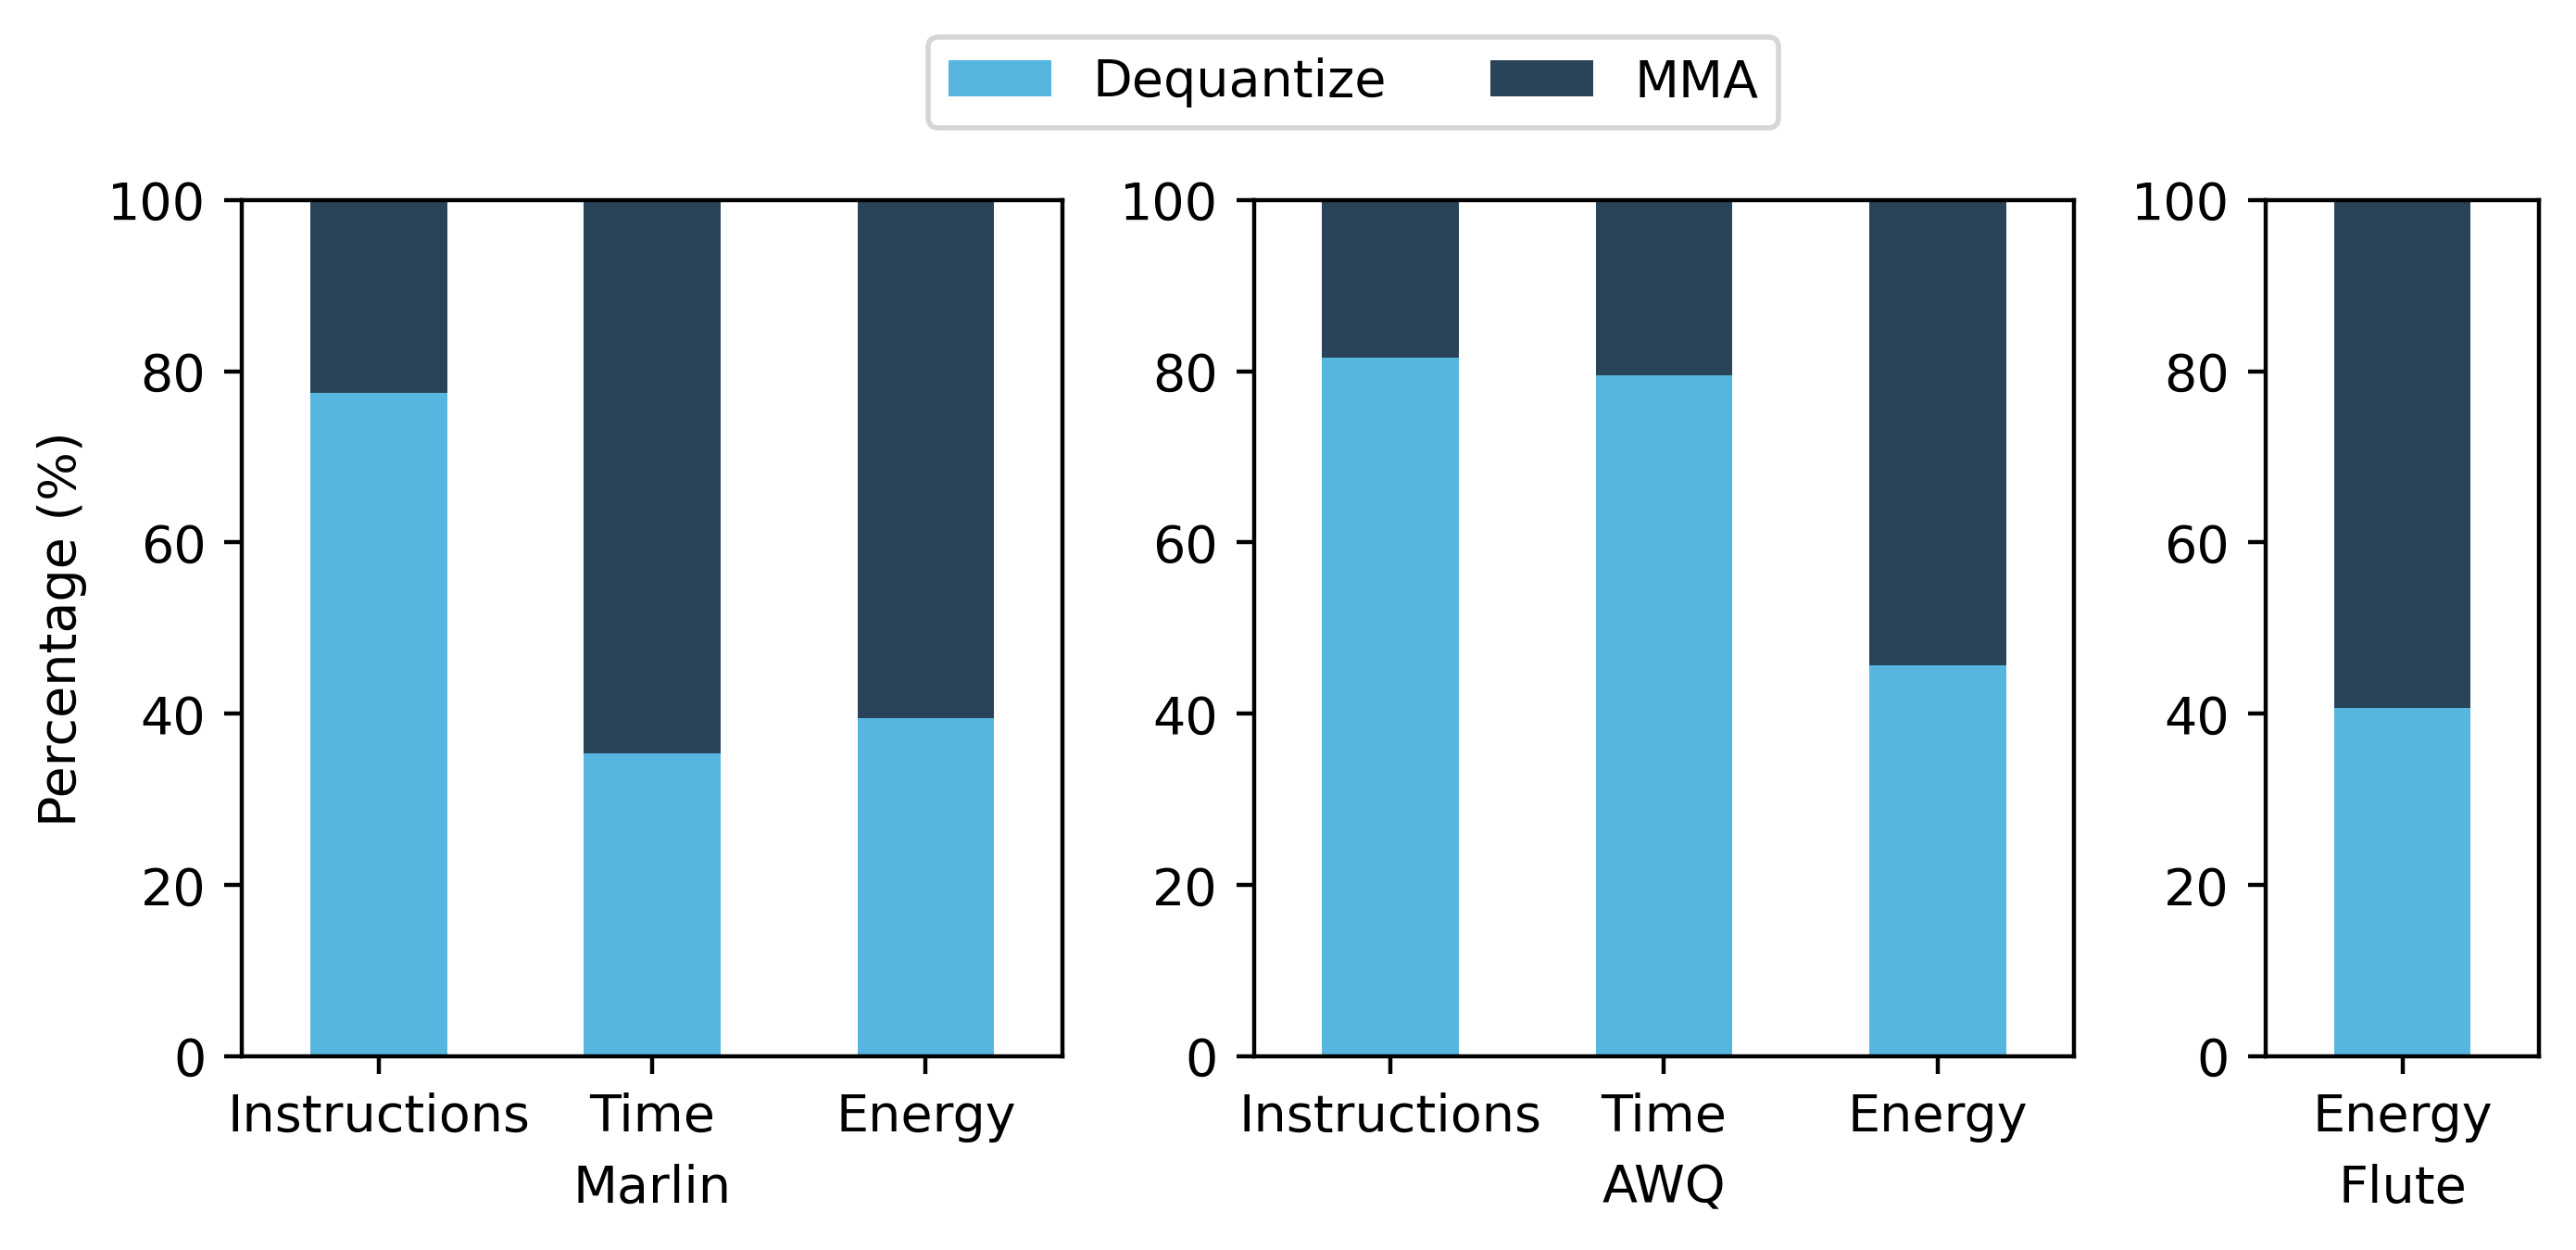
| Marlin | 1 | Dequantize | 77.5% | 35.4% | 39.5% |
| MMA | 22.5% | 64.6% | 60.5% | ||
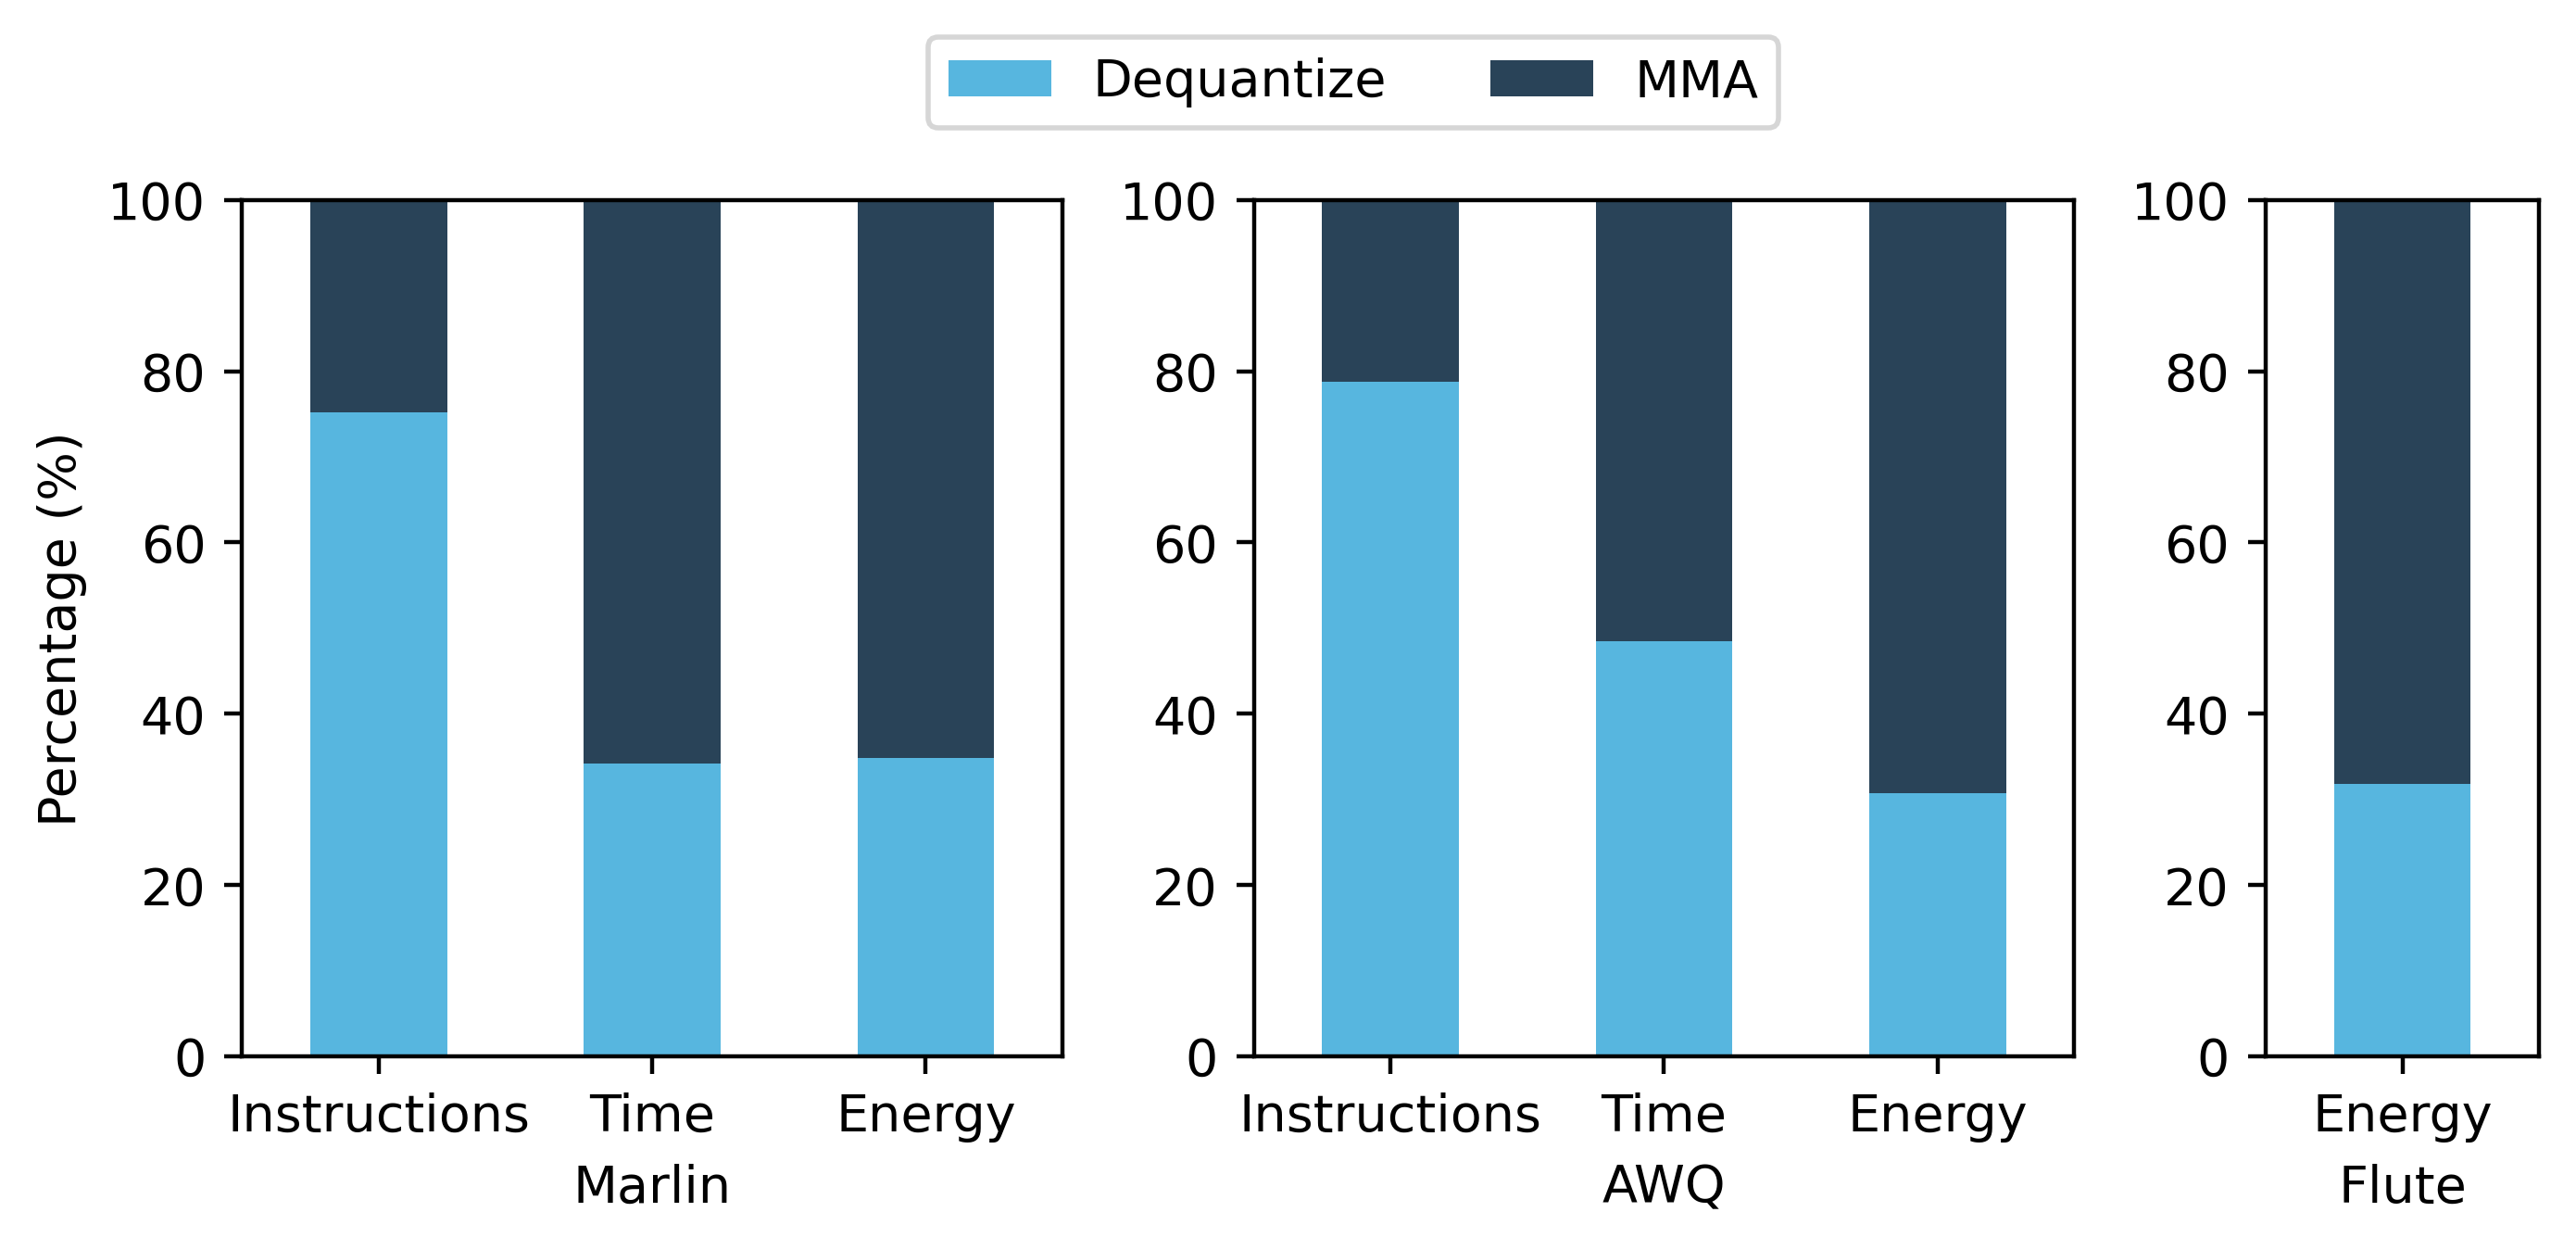
| 8 | Dequantize | 75.2% | 34.2% | 34.8% | |
| MMA | 24.8% | 65.8% | 65.2% | ||
| AWQ | 1 | Dequantize | 81.6% | 79.5% | 45.7% |
| MMA (actually FMA) | 18.4% | 20.5% | 54.3% | ||
| 8 | Dequantize | 78.8% | 48.5% | 30.7% | |
| MMA | 21.2% | 51.5% | 69.3% | ||
| Flute | 1 | Dequantize | - | - | 40.7% |
| MMA | - | - | 59.3% | ||
| 8 | Dequantize | - | - | 31.8% | |
| MMA | - | - | 68.2% |
For the flute kernel, it is hard to separate the dequantization instructions, as many LUT lookup operations involve memory access, leading to counterintuitive results, so we only report the energy breakdown.
Breakdown of kernel results with batch size 1:
Breakdown of kernel results with batch size 8:
Note that “time” refers the average pipeline utilization time of the kernel execution. It does not reflect the actual execution wall time, as GPUs’ tensor cores and CUDA cores are independent, and the test case is memory bound.
Discussion
Dequantization overhead
According to the data above, we can see that dequantization puts a significant overhead on the instruction count, because data format conversions and scaling involves multiple floating point operations or memory accesses. But using tensor cores, the matrix multiplication (MMA) operations only takes one instruction per tile of tensor.
The energy consumption of dequantization takes around 30-45% of the total energy spend on the computation (i.e. excluding memory transfer). This indicates there is a significant overhead in quanitzed LLM inference, as the hardware does not have native support of quantized matrix multiplication, and dequantization is not a free operation. Despite shpwing near-ideal speedups (close to 4x for fp16 → INT4), energy shows a different story. The dequantization overhead can be quantified more accurately using power draw.
The data show that dequantization dominates the dynamic instruction mix: every INT4 weight must converted, and scaled to restore the original weight, costing a lot of floating point instructions. By contrast, one Tensor-Core MMA instruction can process an entire 16 × 8 × 16 tile in a single issue, so its instruction footprint is tiny.
In addition, Dequantization absorbs roughly 30 – 45 % of on-core energy. Those scalar/vector ops still burn joules even they are hidden in wall time. This overhead persists because today’s GPUs lack native hardware support for quantized/scaled and true mixed precision (4bit x 16bit) gemm; every kernel must first “pay the dequantization tax.” Even with Nvidia’s latest Blackwell architecture, which introduced the nvfp4 format, it still does not support mixed precision multiplication.
Despite wall-time speed-ups approaching the ideal 4 × (FP16 → INT4 compression), the power measurements reveal a hidden cost. In short, quantization makes inference faster and lighter in memory, but not “free” in energy. Closing this gap—e.g., via hardware tensor cores or on-the-fly fused pipelines—remains an open opportunity for energy-efficient, edge-class LLM deployment.
Varying kernel input sizes
We experimented more with different input matrix sizes, and found that the energy consumption relative percentage is relatively stable. Below is the raw data of profiling the Marlin kernel with different input matrix sizes on power. Notice that the Marlin kernel is highly optimized and the execution is memory bound, the wall time is almost the same across original kernel and the dequantization/MMA-removed kernels, and the energy consumption is proportional to the power draw. All units below are in Watts.
Raw power measurements:
| M:K:N | 1:4096:4096 | 1:16384:4096 | 1:16384:16384 |
|---|---|---|---|
| mma+dequant | 188 | 283 | 332 |
| mma | 173 | 257 | 297 |
| dequant | 164 | 242 | 279 |
Percentage breakdown:
| M:K:N | 1:4096:4096 | 1:16384:4096 | 1:16384:16384 |
|---|---|---|---|
| mma+dequant | 100% | 100% | 100% |
| mma | 60.6% | 61.0% | 59.0% |
| dequant | 34.5% | 37.7% | 37.7% |
Note that The percentage does not exactly add up to 100% because of small overheads in other parts of the kernel.
Conclusion
In this post, we profiled three state-of-the-art GPU kernels for quantized LLM inference—AWQ, Marlin, and Flute—to quantify the overhead of dequantization. We found that dequantization accounts for 30-45% of the total energy consumption, despite showing near-ideal speedups in wall time. This highlights a hidden cost in quantized inference that needs to be addressed for more energy-efficient deployment. Future work could explore hardware support for quantized operations, or more efficient dequantization algorithms that reduce the overhead without sacrificing performance.
Citing
@misc{abdelfattah2025gpu_profiling,
      title={Quantifying GPU Performance overhead for Quantizated LLMs},
      author={Xilai Dai and Mohamed Abdelfattah},
      year={2025},
      url={https://abdelfattah-lab.github.io/blog/gpu_profiling},
}